Have you recently come across a situation where, one of your old investments came up for renewal which had earned you a decent rate of interest but the renewal rate of interest is so low, it made you feel bad and really contemplate whether to renew or not? Don’t worry, you are not the only one facing this, there are many others, who have traditionally invested in such fixed rate saving schemes/deposits and are now facing a similar situation as you. There are also those who saved in various savings schemes which committed a specific rate of return, which are now lowered year after year.
These lower interest rates would mean different things to different segments of people. While existing and potential borrowers are delighted to see interest rate getting lower, investors in fixed income instruments area worried a lot for obvious reasons. The worst suffered are senior citizens who depend largely on the interest from their fixed deposits and small savings.
Can an investor do something about the low and further lowering interest rate condition? Is there a way to use the falling interest rates scenario to one’s benefit? What most of us know is that falling interest rates lead to lower returns on most traditional saving avenues. But what most investors are not aware of is that there are fixed income investment avenues which give higher returns in a falling interest rates scenario
This means that there is an inverse relationship between returns and interest rates movement and these investments gain when interest rates come down. These are known as debt mutual funds. Debt mutual funds, as you may have heard, invest in various fixed income instruments like bank certificates of deposits (CDs), commercial papers (CPs), treasury bills, government bonds (G-Sec), corporate bonds/debentures, cash and call instruments, and so on.
Debt mutual funds are classified based on the category and tenure of the underlying investment instruments and one can choose a suitable category depending on one’s investment horizon, risk appetite and returns expectations. So how do debt mutual funds make money for the investors? When one invests in a debt mutual fund, they are allotted units as per the prevailing NAV (Net Asset Value) of the fund. Interest rate decline has a positive impact on the price of the instruments in the portfolio of the debt funds, thereby increasing the NAV of the fund.
Now, the same units held by the investor are worth more than what the investor first invested thus generating generous returns. With the interest rates reducing, the better performing debt funds are the ones holding instruments with a higher maturity. Hence debt fund investors are in a sweet spot and will continue to remain so till the interest rates continue to tread lower.
Changing times demand better adaptability to the new conditions. Why should this not be true for one’s investments? Be it in terms of liquidity, superior returns, professional management or tax benefits, debt mutual funds score over traditional savings avenues.
A more beneficial approach would be to consider debt mutual funds which enable to make the most of falling interest rate regime by providing tax efficient returns as well as regular income. Investor should however, consult their financial and/or tax advisors to ascertain whether mutual funds are suitable for them. After all, higher returns come with the possibility of higher risks.
The prime objective of every investment made is to create wealth. Though lucrative, creating wealth isn’t an easy task. It requires knowledge, skills, time and some amount of risk taking. Investors always want their investment to be profitable and no one desires losses. Not all investors are financially sound or have an inclination or the required time to be up to date to the market happenings; this paves way for entities which facilitate the investment route for investor by rendering advice and ease of transaction. Stock Brokers and Mutual Funds are such entities and investors often are faced with a choice whether to invest in the Indian Equity markets directly; by investing in stocks through a recognized stock broker or take an indirect route via Mutual funds.
Direct exposure to stocks is feasible for those savvy investors who understand the nitty-gritty of stock markets. Here, investors need to analyze and choose the equity shares to invest in. However this is easier said than done. Choosing a good equity share requires broad understanding of the economy, sectors and the companies in the investment universe. Before investing, one has to go through the financials of the company like balance sheet, profit & loss statement as well as all other parameters that indicate the health of the enterprise. Moreover, investors should also possess other skill sets like analyzing the past trends and project the future earnings too. Their investment decision hence becomes dependent after taking a holistic picture. Overall, to be successful, the investors are hence expected to be great stock pickers. However, not all the investors have the knowledge and the required time to research about various companies, sectors or overall trend of markets. Hence, an indirect approach i.e. investing through mutual funds becomes a preferred medium to take exposure to equities. Let’s look at parameters which make investing in equity mutual funds far more beneficial than direct investment in equities:
Professional management: Mutual funds are managed by skilled and experienced professionals who not only understand the markets but also track them regularly. These experts analyze company’s performance & prospects before selecting suitable investments to achieve the investment objective. In any given environment, they try to find out the best companies to invest in based on their extensive research. A professional fund manager ensures that the portfolio holds quality stocks with potential for long-term returns.
Diversification: In case of direct investment, an investor might have bias towards a particular stock or a sector; based on which one may have excess exposure in that stock. Other individual might not have sufficient funds or mental bandwidth for a diversified portfolio. Mutual fund invests across companies and sectors thus reducing the overall risk of the portfolio by means of diversification. Additionally, there are sectoral limits and individual stock exposure limit in place which helps in spreading the risk and reducing concentration.
Variety of funds: Mutual fund offers various categories of funds catering to different investment need of an investor. There are sectoral funds and thematic funds, there are also funds based on market capitalization namely large cap funds, mid & small cap funds, diversified fund etc. Based on the risk appetite and the investment need one can choose the type of fund to invest in. For eg: An aggressive investor can look at sectoral or thematic equity fund while a moderately aggressive investor can look at diversified fund or a multi-cap fund.
Though direct investing might excite many investors; the risks associated with it are equally high. Stock market investing is a serious business and requires significant amount of time and resources in order to be successful. If an investor is well versed with the nuances of investing and has the time to devote for investing, one can opt for direct investing via a stock broker. Investors who are looking for hassle free, cost effective and an efficient mode of investing in equity markets may invest via Mutual funds.
The phrase ‘financial planning’ is touted as a money management tool for individuals. What is it all about and how to get your own financial plan going? Read on to know it all…
What is a financial plan? Kiran and Jatin were married last year. Both are in their late 30s. While Kiran is a finance professional, Jatin is an architect. Jatin is keen on growing his business for which he needs funds, The couple also aspires to own a home (they live in a rented accommodation). Besides, they have other aspirations such as having a child, going on a foreign vacation, owning a car, etc. In other words, they face the dilemma of limited means and a number of needs.
What is important for the couple to do is to first prioritize their needs and goals. Once this is done, they can work towards saving and accumulating funds to achieve each of these goals.
Let’s consider buying a home. Let’s say the couple plans to buy a two-bedroom home in a suburb where, depending on the rate per square foot, the expected cost of a suitable home is about Rs 50 lakh. Now that they have arrived at this number, they will need to plan how to fund this cost. They can take a home loan for a part of the cost and invest the balance from own funds. They will need to understand and plan on how to pay the home loan EMIs. This is an example of goal planning.
Just like an architect makes a building plan before commencing construction so that he knows what he is going to build, how much it would cost, by when it is likely to be completed, etc., a financial plan is the document on the basis of which your financial life can be moulded to achieve all that you want in life. It is nothing but a blue print of your financial future.
What is the need? Well, our financial resources in life are limited and the demands on it, almost infinite. The limited resources are to be utilized judiciously to achieve the maximum that we desire from life. A financial plan is in part a reality check on your current financial position and in part a road map to where you want to reach. In short, it acts as a bridge connecting your present and future, reality and dream. Without a well thought out plan, your finances face the risk of going haphazard with no aim or purpose. When you are clear about where you are and where you want to reach in life, the possibility of achieving it is improved, isn’t it?
Baby steps culminate in a marathon Every marathon begins with the first step. Those who made the first step are running and those that haven’t are still watching. Well, life waits for none, right? So make your start now. Financial planning is not rocket science. It is mostly common sense and prudence. It may look like a daunting task initially. Take the baby steps. Start by analyzing your financial health. What you own, what you owe, how much do you save, where is your wealth now and where are you investing. Put a number to your future wishes and dreams. Be clear about when you want to achieve them and how much it is going to cost. This will give you an idea of what is required to reach there, in terms of savings and investments.
The milestones to be crossed Life is full of events, both expected and unexpected. Being prepared to face them reasonably well is the cornerstone of financial planning. Break your life journey into smaller segments with identified milestones. Focus and work towards achieving those small tasks which will eventually lead you to your larger goals. Put away money for these tasks before you spend.
Manage the pitfalls Life does not always play out exactly as per your script. You may encounter unexpected bumps and trenches. Twists and turns are integral to life. Being prepared to handle those nasty surprises that life throws at you is important to financial success. Identifying the risks that you face in life is an integral part of financial planning too. The lurking risk could be premature death, a debilitating injury, a huge medical bill that can cripple your finances forever or anything that leaves a lasting impact on your financial life. Protect your wealth and family with adequate insurance. Many a time, insurance seems a wasteful expenditure. It would appear so only till the moment life hits you hard.
Stay the course Good financial decisions and actions bear fruit only in the medium to long term. So do not get frustrated if you fail to see instant results for your actions. Remain committed to the prudent and wise course you have charted for yourself. Having a plan in itself is a laudable achievement. The benefits would trickle in over time provided you have the conviction and patience to stick toyour plan. Always visualize the larger picture that such financial discipline would eventually build for you. This would keep you moving even when the going seems uninteresting.
Mutual funds are professionally managed collective investment schemes that seek to deploy investors’ money as per their mandate and generate optimum returns by balancing the risks involved. They have a hierarchical organization structure with multiple checks and balances to ensure protection of investor interest. While the Asset Management Company (AMC) is involved hands-on in the investment activity, the trustees keep a keen watch on the functioning of the AMC and the other functional agencies like the custodian, registrar, etc. Mutual funds are tightly regulated by the capital market regulator Securities and Exchange Board of India (SEBI) with strict norms of investment and reporting. The disclosure level of the mutual fund industry is unparalleled in the Indian financial product landscape.
Is there a need for you to keep track? Given the above secure environment in which mutual funds function, it may appear that investing in these products is a do-it, forget-it affair. Well, not necessarily. While the systems and controls take care that your money is handled prudently and your interests are taken care of adequately, you need to keep a tab on the investments from the perspective whether they continue to remain relevant to your goals and risk appetite. It is your responsibility to ensure that you get what you expected or were communicated. Here’s how you can go about keeping track of your mutual fund investments.
Keep track of performance: While mutual fund schemes have an identified benchmark against which their performance is compared; they also need to compete with similar schemes that operate in the market. So it is necessary that you evaluate the performance of your funds periodically against their own benchmark index and also comparable funds. You should keep in mind that evaluation should be done within the framework of the fund mandate and behaviour of the financial markets in general. For example, an equity fund may under-perform in the short term while it has been invested with a long term strategy. And you should compare peers (comparable funds) with similar investment objectives and style to understand the real picture behind performance.
Monitor investment style: A fund may have claimed to invest with a value approach to stock picking but may gradually veer to a growth style. Or a mid-cap fund may morph into a multi-cap fund due to the circumstances of the financial market. It is important that you keep track of the style integrity of your funds. A change in style could change the risk profile of the fund such that it may increase the overall risk of your portfolio as a whole. Sometimes the investment style and strategy is well defined in the Scheme Information Document (SID) of the fund and one may refer to it to get a clear picture of what is allowed and what is not.
Fund manager change: While many fund houses have evolved investment processes that function smoothly without overdependence on individuals, a fund manager does impart his own touch and expertise to the fund performance. Smart sector and security selection skills of the manager do add value to a portfolio. You hence need to keep track of any change in the fund manager and the credentials of the new manager, if there is a change. You may need to evaluate the changed investment approach of the new manager to ensure it fits your own.
Portfolio holdings: You would need to watch the concentration of the holdings by keeping track of the fund’s top 10 holdings or top 25 holdings. If this proportion is too high, it may indicate extra risk to the portfolio. At the same time if it is too low, it may mean too many holdings in the portfolio which may not be optimal. You would also do well to assess the quality of the portfolio by monitoring parameters like credit quality, duration, and yield to maturity of a debt fund. In an equity fund, exposure to small cap stocks, valuation of the portfolio like the Price/Earnings (P/E) ratio, Price/Book (P/B), dividend yield, etc. are important parameters to watch.
Where do you get the required information? The whole exercise of tracking your mutual fund investments is not as complicated as it appears at first glance. There are a variety of tools that you can utilize. Some of them are: Fund house documents like fact sheets, investor newsletters, etc. are a rich source of information on your mutual fund schemes. They disclose all pertinent data of your holdings. You may also refer to the Scheme Information Document (SID), Key Information Memorandum (KIM), etc. issued by the fund houses.
Online tools provided by financial portals and mutual fund dedicated websites provide objective information and opinions on various mutual funds and also provide you the facility of creating your portfolio on their site. So you can get not only current status but also in-depth analysis of your portfolio along with expert views on your holdings. While a good beginning is half the job done, you need to do the other half too by periodical monitoring and review. After all, “trust but verify” is a good approach in money matters, right?
Rehaan has decided to invest in a pool of debt funds. He has looked at the past performance of debt funds and shortlisted the same starting from the best performing fund. After reading the risk disclaimer, “Past performance of the Sponsors, AMC/Fund does not indicate the future performance of the Schemes of the Fund”, Rehaan is confused. If past performance is not the only factor for selecting debt funds, then what are the factors to be considered while selecting debt funds?
1. Assets Under Management (AUM) and Average Maturity: The size of the fund (AUM) might not make a big difference while investing in equity funds. But in case of liquid funds and Ultra short term funds, AUM plays an important role. Fund managers handling funds with higher AUM would have extra head room to buy relatively longer term debt papers which would contribute to marginally higher returns. The portfolio maturity is represented by Average Maturity of the fund. Higher average maturity refers to the fact that fund is holding on to longer term debt papers compared to other debt funds.
Funds
Net Assets (Cr)
Average Maturity (Yrs)
1-Year Return (%)
H Liquid Fund
25633.80
0.08
8.21
R Liquid Fund
5396.69
0.08
8.19
I Liquid Fund
26149.74
0.07
8.19
C Liquid Fund
2203.32
0.04
8.08
“H Liquid fund” holds papers with longer maturity. This could be one of the reasons for higher returns from the fund.
An investor needs to be aware of the fact that as average maturity increases the interest rate risk (market risk) of the fund also increases. Whenever there is a sudden change in interest rates, funds with higher average maturity would be more sensitive towards the change than the funds with lower average maturity.
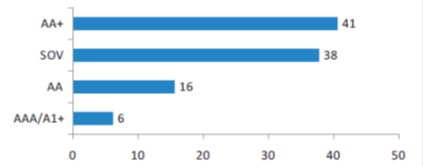
2. Credit quality of the portfolio: Credit quality in debt funds is based on the debt papers/bonds held by the funds. The debt instrument’s credit quality is measured by credit rating given by rating agencies. AAA is the highest rating given followed by AA, A and so on. As the credit rating goes down, the credit risk of the investment increases.
Illustration: Sample credit profile of a debt fund Debt papers with higher credit risk offer higher rate of return to compensate for the risk. Credit rating of the portfolio is another key contributing factor in the fund returns.
Fund
Net Assets (Cr)
Average Maturity (Yrs)
1-Year Return (%)
Average Credit Quality
F Liquid Fund
3053.6
0.09
8.38
AA
H Liquid Fund
25633.8
0.08
8.21
AAA
R Liquid Fund
5396.69
0.08
8.19
AA
I Liquid Fund
26149.74
0.07
8.19
AAA
C Liquid Fund
2203.32
0.04
8.08
AAA
In the above given illustration, “F Fund” has invested in longer term paper (represented by higher average maturity) and average credit quality of the portfolio is AA. Because of these two factors the “F Fund” has given highest possible return among other funds.
3. Interest rate view – Specifically for duration management funds: View on the interest rate is one of the most important factors to be looked at before investing into funds like Bond/Income funds and Gilt Funds. There is an established thumb rule which states:
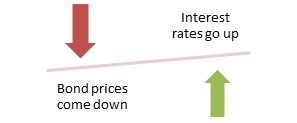
The most important factor that influences interest rate is inflation. When inflation is in upward trend, to keep inflation under check, RBI increases the policy rates (like REPO, Reverse REPO, CRR, SLR etc). When the policy rate goes up, so does the over-all interest rate. This results in bond prices going down. The medium and long term debt funds tend to give negative returns.
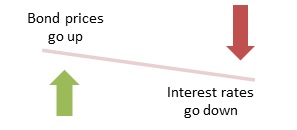
When the inflation is cooling down, the anticipation from the market is that RBI would reduce the rates. A fund manager would like to buy long term bond to take advantage of such a scenario. If inflation and interest rates are expected to come down in near term, it makes sense to buy a fund with higher modified duration.
The bond prices appreciate when interest rates go down thus helping the debt fund to appreciate With inflation and interest rates going up, it’s safe to invest in funds with lower modified duration.
Having invested in mutual fund schemes for some time now, you have understood that Systematic Investment Plans (SIPs) are one of the best ways to accumulate wealth towards meeting your financial goals. By making small investments over the long term you can build wealth to meet your future financial commitments. With SIPs, you can make a continual and steady progress towards your financial goals without waiting to accumulate a large amount before investing.
But, it is natural for even the most disciplined investor to get anxious when markets become very volatile and accumulated wealth starts deviating from desired growth path. The most instinctive action in such conditions is to stop further investments and even withdraw accumulated wealth if volatility persists for longer. But, would that be a wise thing to do? Let’s sit back and analyse the situation…
Let’s go back and try answering the question as to what was your purpose of making systematic investment in the first place? Was it to time the market and make short term tactical decisions or was it to save and accumulate wealth over a period of time – a well thought through decision to build wealth for you and your family? It most surely was the later. If building wealth was your ultimate goal, there is every reason for you to be happy that your cost of purchase is lower and you are able to get more units for each of your SIP instalments. Here’s how…
Month
Amount Invested
Falling NAV
Units bought
Total Units bought
Average Cost
Month 1
5,000
10.0953
495.280
495.280
Month 2
5,000
9.9073
504.678
999.958
Month 3
5,000
9.6783
516.619
1516.577
9.8906
Month 4
5,000
8.8906
562.391
2078.968
Month 5
5,000
8.7620
570.646
2649.614
Month 6
5,000
9.1480
546.567
3196.181
9.3862
Total
30,000
3196.181
As can be seen, each Rs.5,000 invested is able to buy more number of units as the NAV is falling, except for the last month which bought less number of units than the previous month because of higher NAV than the previous month. Another way to look at this would be to see yourself benefitting from a lower average cost. If you had stopped your SIP midway, after the 3rd month, your average cost would have been Rs.9.8906 (Amount invested Rs.15,000 divided by Total units bought 1516.577) which is much higher than Rs.9.3862 (Rs.30,000 divided by 3196.181 units) if you continue till the 6th month.
Now, let’s analyse what happens if you withdraw all your investments mid-way? If you redeemed after the 6th instalment in the same illustration, your investments would get impacted in two ways. First, the value of your investment (Rs.9.1480 x 3196.181units = Rs.29,238.66) may be lower than the total investment you made (Rs.5,000 x 6 instalments = Rs.30,000) and second, the most recent investments may not be free from the exit load period, meaning that the amount available to you would be even reduced by the exit load charged. These charges usually cannot be reversed, once charged.
Having discussed that ‘stopping’ or ‘stopping and withdrawing’ a current SIP in a volatile market environment is not the most favourable action, we can summarise the advantages of continuing an SIP in the following paragraphs.
Let’s understand the advantages of continuing an SIP in a volatile market. SIP, as the name suggests, is a systematic way of going about your investment activity. Quite often, lack of time and doubts about market movement are the factors that affect one’s investment activity. SIP is a tool that works to overcome these factors. By doing an SIP:
You are eliminating emotions from your investing activity. SIP makes the investments as planned without any further intervention from you. Thus you are spared of the decision-making agony every time you need to invest.
By deploying your surplus regularly, you are utilizing it effectively towards achievement of your financial goal. Every instalment takes you a step closer towards fulfilment of one or more of your financial commitments.
Fear of market fall is the biggest deterrent to equity investing. But in an SIP, you would be leveraging this possible fall to your advantage. As evident from the above illustration, you would in fact be buying more units with every fall in the market. In the above illustration, while the average of the NAVs is Rs.9.4136, the average cost of acquiring the units works out to Rs.9.3862 only. Clearly, the very market volatility that an investor fears has in fact worked to her advantage.
Market cycles and their impact From 2004 to 2008, the Nifty moved from 2000 levels to 6000 levels. Investors would have seen their net asset value steadily increasing; every SIP would have given them fewer units. But in the middle of 2008, the financial crisis hit the markets. The Nifty crashed all the way back down to 2500 levels. Investors would have seen their NAVs erode sharply and the temptation would have been to exit their SIP commitments.
However, those who continued investing using SIP received more units due to fall in prices. Their average buying price would have been reduced sharply. After a couple of years, the markets returned to their upward surge. These investors saw the NAVs rise again, and this time, they were rewarded with attractive gains as a result of not only remaining invested, but continuing to invest in a falling market (in 2008).
Financial goals Volatility in the market is common usually accompanied by steep falls such as the crash in the early 2000s due to the dotcom bubble and the South East Asian crisis or the banking industry led recession of 2008. Political fortunes in the country also play a role in market volatility. Other factors such as oil prices and U.S. interest rate policies also contribute to market volatility.
The worst thing an investor can do is to enter the market at peak levels and exit at low levels out of panic. Remaining invested over the long term through peaks and troughs and moreover, using the SIP investment strategy to continue investing, is a smart way to build wealth.
Note: The given examples are for illustration purpose only & shall not be construed as indicative yields/returns of any of the Schemes of Canara Robeco Mutual Fund. Past performance may or may not be sustained in the future.
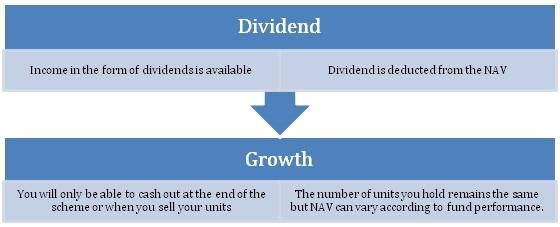
You have decided to take advantage of the tremendous flexibility that mutual funds offer. Congratulations. One such flexibility offered is whether you want to receive income from your mutual fund investment or let your income remain invested till you cash out of the scheme. While the former is called ‘dividend option’, the latter is called ‘growth option’. Let’s understand both these options better.
Dividend option offers you regular income. Dividends are distributed by the fund depending on the distributable surplus that the scheme has accumulated. As an example, if you own 1,000 units of a mutual fund and the fund declares a dividend of Rs. 3 per unit, you will get Rs. 3,000 as ‘dividend in an equity oriented scheme‘. However, in other schemes, the scheme would have to pay a Dividend Distribution Tax (DDT) and hence the dividend you receive would be lesser by that amount. The Net Asset Value (NAV), which reflects the realisable value that you will get if you sell your mutual fund investment, will fall proportionally and get readjusted after the dividend is paid. (Note: The NAV in reality may not fall exactly to the extent of dividend declared. NAV is also impacted by changes in prices of securities invested in.)
The declared dividend may also be re-invested by buying additional units of the scheme. The dividend amount would automatically be utilized to buy additional units which would be added to your existing holdings. For example, the Rs. 3,000 dividend received in the above case would be reinvested as below:
Existing unit holdings
1,000 units
Dividend amount
Rs. 3,000
NAV of scheme after dividend
Rs. 17
No. of additional units purchased
176.471 units (3000/17)
Total units held after dividend reinvestment
1176.471 units
The above table is for illustration purpose only & shall not be construed as indicative yields/returns of any of the Schemes of Canara Robeco Mutual Fund. Past performance may or may not be sustained in the future.
Growth option on the other hand, does not offer you any regular income; instead all the money that the scheme generates from its investments is simply put back into it in order to generate capital over time. So this means that you will always have the same amount of units that you purchased when you entered the scheme. The NAV of the scheme keeps changing according to fund performance.
Taxation on dividend and growth options One of the key differences between the dividend and growth options is tax.
Dividend option: Dividends received on your investment in equity funds are tax-free. However, dividends received on non-equity funds are taxed; here, the mutual fund has to pay the tax and then distribute the net amount as dividends.
Growth option: In case of choosing the growth option, the following tax implications may arise due to capital gains. If you hold your equity mutual fund investment for more than a year, the profits are not taxed and are termed as long term capital gain. If held for less than a year, it is termed as short term capital gain and is taxed at 15%.
In case of non-equity funds, if you hold for more than 3 years, the profits are termed as long term capital gain (taxed at a lower rate); otherwise, they are termed as short term capital gain (taxed at a higher rate).
Choosing between Dividend and Growth Options Choosing between dividend and growth options is a matter of individual choice and needs. It may also depend on whether you are investing in equity or debt funds. However, it is best to keep in mind that if you are an investor with a need for regular income, it is best to opt for the dividend option. You will get an element of liquidity from your investments, as some of the money that you invested will flow back to you regularly. If your aim is to let your money grow in the long term, choose the growth option. In the growth option you get the benefit of compounding as the returns on your investment are reinvested, this is not the case in the dividend option.
While investing in an Equity Mutual Fund, an investor thoroughly evaluates the fund attributes and portfolio construct. However, when it comes to Debt Mutual Fund the same approach is not followed as investors are not well versed with the different aspects of Debt Mutual Funds. It is important to understand these aspects before investing in a Debt Mutual Fund.
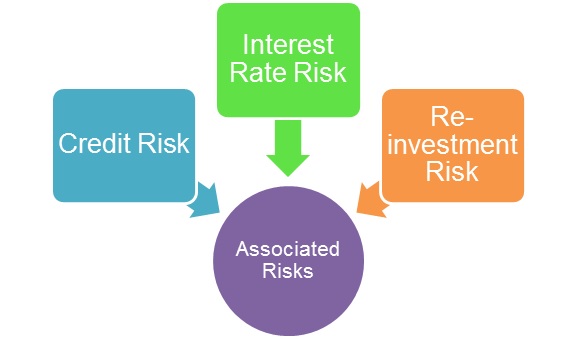
1. Risk Element: Contrary to popular belief that Debt Mutual Funds are risk free investment avenue; they actually have following inherent risks:
Credit Risk: It is the risk of loss of principal or any other cash flow due to borrower’s inability to meet his financial obligations.
Interest Rate Risk: Fluctuation in interest rates affect the price of the bond; as interest rate rises, bond prices fall and vice versa.
Re-investment Risk: Risk that the future coupon from a bond may not be re-invested at the prevailing interest rate when the bond was initially purchased.
2. Asset Allocation: A scheme’s portfolio lays down the instruments where the scheme has invested in viz. Government securities (g-secs), commercial papers (CPs), certificate of deposits (CDs) etc. Depending on fund’s investment objective and fund manager’s view about the interest rate movement, the scheme’s asset allocation is decided. For e.g. If the Fund manager is expecting interest rate to fall, he might increase allocation to g-secs. While in scenarios of interest rate rise, the fund manger may increase allocation to shorter term instruments like commercial papers etc. Thus, the fund manager may tactically alter the asset allocation to combat interest rate risk.
3. Rating Allocation: Credit risk of a scheme can be deduced by the credit rating of instruments where the scheme has invested in. Following is the generalised definition of ratings and indicative level of safety:
Ratings for Long Term Instruments
Level of Safety
Sovereign
Investment in G-sec. High degree of safety
AAA
Highest Safety
AA
High Safety
A
Adequate Safety
BBB
Moderate Safety
BB
Moderate Risk
B
High Risk
C
Very High Risk
D
Default
Ratings for Short Term Instruments
Level of Safety
A1
Very strong degree of safety
A2
Strong degree of safety
A3
Moderate degree of safety
A4
Minimal degree of safety
D
Default or expected to default
4. Maturity Profile/Average Maturity: Maturity profile represents the maturity of all holdings in the fund’s portfolio. Average maturity is average maturity in days or years of all instruments held in the portfolio. Money market or short term funds might allocate majority of their corpus in short term papers; hence, they will have low average maturity.
5. Modified Duration: Bond prices are inversely related to interest rates. Thus when interest rate rise, bond prices fall and vice versa. Modified duration measures the price sensitivity to the change in interest rates. For e.g. If the Modified duration of a Debt Scheme is 3 years and if interest rate falls by 1%, the NAV of Debt scheme is likely to go up by 3%. So if the fund manager is expecting that interest rates are likely to go down in future, he is likely to increase the modified duration of the scheme.
6. Yield to Maturity (YTM): It is the total return anticipated on a bond if the bond is held till maturity.
Investing directly in stocks, if you want to do it well, is highly complex. Stocks are from a bewildering array of companies that are in different industries, have differences in size, financial structure, track record, competitive environment and a lot more.
Investing directly in a small number of stocks also has more risk than investing in a large number of stocks. Analyzing companies and deciding which stocks to buy is time consuming. Furthermore you need to keep track of company developments and have a system in place to keep track of the performance of your investments. It is for these reasons that you should consider investing in mutual funds.
Typically, mutual funds combine the savings of a large number of investors and manage it as a single pool of money. Equity funds then invest in a significant number of companies.
Instead of you worrying about which stock to invest in, professional fund managers do the job backed up by a team of analysts that constantly researches the companies that are designated to them.
Also, there is an extremely beneficial method known as a Systematic Investment Plan (SIP), which allows for automated, regular investments of a relatively small amount of money, which is something that is difficult to implement when you invest directly in equities.
THERE ARE OTHER ADVANTAGES OF INVESTING IN MUTUAL FUNDS INSTEAD OF DIRECT EQUITIES
Mutual funds offer instant diversification
Mutual funds are convenient
Mutual funds are cost efficient
Mutual funds are well regulated
Mutual funds offer liquidity
Mutual funds offer a choice of investments depending on your risk profile
Raj came to office on 1st January in cheerful spirits after celebrating the New Year in gusto. The same day he received a mail from the HR department requesting for investment declaration proof. His joy immediately turned to worry ‘how do I arrange for Rs.1.5 Lakhs for investments to claim tax deductions?’ He had spent most of his salary & had hardly invested any amount during the year. He had declared investment of Rs.1.5 lakhs to claim tax deductions but could barely mange to invest Rs. 75,000 till the deadline. It was a sort of double whammy; first, he was cash-strapped since he had to invest all that was available and second, due to higher tax out-go his net salary in the last two months was quite low. Despite having a similar experience in the previous year he continued the same practice.
The scenario is quite common in offices. People generally declare the maximum investment ¬figures at the start of the financial year & come January they are either scurrying to collect funds for investment or their last two months salary takes a hit. Rather than struggling at the last minute one can consider small & systematic investment spread over the year. Investing a monthly amount of Rs. 12,500 allows one to meet their yearly investment target & enjoy the complete benefit of tax saving! (Monthly installment Rs.12,500 x 12 months = Rs.1,50,000)
While tax saving is important one should also strive to invest the amount prudently in order to reap maximum benefit of the savings. Thus one gains twofold i.e. decrease in tax liability plus return on investment.
Investment Avenues for Tax Saving Under Section 80 C one can invest in PPF, NSC, Bank FDs, Life Insurance & ELSS are various investment instruments eligible for tax saving. Amongst them ELSS enjoys the shortest lock – in period of 3 Years. Also Equity Linked Saving Schemes (ELSS) allows one to benefit from the long term growth potential of equities and offers the facility to invest the amount systematically: Systematic Investment Plan (SIP)
Systematic Investment Plan (SIP): A Smart Way to Save Taxes too!
SIP is a strategy whereby an investor commits to invest a fixed amount at specified intervals.
SIP allows one to achieve tax saving in a systematic & hassle free manner: As a fixed amount gets invested automatically each month, the investor does not have to worry about making hasty last-minute lumpsum investments for saving tax.
Law of Averaging at work – Rupee Cost Averaging at its best: investing the same amount on a regular basis will lead to one getting more units when price is low and one getting less units in case price is high.
Small Ticket Sizes do not impact the wallet too!
Focus on consistent & continuous investments – Fixed Money for Fixed Period of time to benefit from market volatility.
Imparts Discipline in investing – The most needed quality for a long term investor.
Each SIP would attract a 3 year lock-in period.
Invest through SIP to make Tax Planning Quick & Effortless!
Let bygones be bygones, Raj is a wiser individual if atleast for the coming financial year he signs-up for a SIP at the start of the year itself.
The above calculation is an example only for illustration purposes & shall not be construed as indicative yields/returns of any of the Schemes of Canara Robeco Mutual Fund.
Much like you tell children that constant practice and hard work will allow them to excel in their studies, continuous and consistent investments allow you to make a considerable profit. However, the chaos of daily life takes over and you tend to let things like investments fall through the cracks, putting it off for another day. For many of us, the end of the month brings with it the realization that there really isn’t anything left to invest.
Therefore the first step is to prioritize investing. Once you make that decision, you need to make it a part of your lifestyle. However, especially for beginners it is important that this be achieved without too much hassle. Wouldn’t it be ideal if investing were an automatic process?
SIP: hassle free investing This is very much a possibility. You can make hassle free, regularinvestments through a Systematic Investment Plan (SIP). SIPs allow you to invest a pre-determined amount of funds on a monthly, or quarterly basis for a specified period of time. Once you sign up, you have to do absolutely nothing at all. The process is completely automated. So how does that work? You basically give the mutual fund the permission to automatically debit your bank account for the amount that you had decided to invest. The money is then invested in one or more schemes that you had specified at the time of signing.
SIP: even for small amounts One of the big advantages of investing through a SIP is that it works well regardless of how much money you have, or earn. The truth is that today, with your increasing needs and wants, along with the high cost of goods, it is hard enough to live within your means. Investing seems like it might clip your wings further. A SIP takes away this pressure because you can invest as small an amount as you wish to and it will still make a difference to your finances in the long run. You can begin a SIP with as little as just Rs. 1,000 per month, or Rs. 2,000 per quarter. Some mutual fund schemes allow you to start investing with an even lower amount.
SIP: allows for flexibility An SIP allows some flexibility as well by giving you the option to choose the date of the month/quarter that the investment is made on your behalf. You are also able to increase your SIP amount if you are in a better financial position at a later time. You can decide to invest through an SIP in almost all open-ended mutual funds, and you are not restricted to invest in only one scheme, but can select several schemes at the same time. This also means that you can invest in a variety of asset classes like equity, debt and gold, which makes it possible to manage your asset allocation targets.
SIP: averaging out purchase costs This brings us to the golden truth about SIPs — whatever the market situation, chances are you usually come out a winner. This is because you are investing with smaller amounts at regular intervals instead of just one big chunk at a time. A one time investment needs good timing to ensure good returns. On the other hand with an SIP it does not matter when you enter the market because over time the cost of your investments usually average out — you will be able to buy more units when the market has fallen and less units if the market peaks. Over time you average out your purchasing cost. This is more popularly known as “Rupee Cost Averaging”.
SIP: don’t spend time timing the market, spend it in the market The investing mantra to follow is — spend time in the markets, don’t spend time timing the markets. Why is spending time in the market so important? The longer your funds are invested, the higher the likelihood that you might have a more significant return. See the chart below.
In all 3 cases the total invested amount is the same. The main difference is the time that was spent in the market and the monthly invested amount. Even with a small amount like Rs 2,000 one could possibly build a kitty of approximately Rs 6.4 lakh in 12 years.
Compare this to the end value of someone who invests three times as much on a monthly basis but does this for a much shorter period and the estimated end value is not nearly the same.
Investment Period
Amount invested per month
Total Amount invested
Expected End Value
12 yrs
2,000
288,000
638,123
8 Yrs
3,000
288,000
479,782
4 Yrs
6,000
288,000
367,336
The above table is an example only for illustration purposes. It is purely to explain the effect of compounding on investments over a long term. The growth rate of the investment is assumed at 12%. Please note the growth rate mentioned above is purely for illustration purposes only & shall not be construed as indicative yields/returns of any of the schemes of Canara Robeco Mutual Fund.
As you can see, the growth potential of starting early, even with a small amount, is tremendous. Also, investing through SIP facilitates disciplined and regular investing, even with small amounts of money. This is possibly the reason why it is very often the first step many people take when entering the world of investing.
The bottom line: Just as every drop in the ocean matters, small investments starting today can give you the power to live out your dreams tomorrow.
The essential thing is don’t waste another day thinking about it. Do it today!
Market capitalization is the total rupee market value of all of a company’s outstanding shares. It is calculated by multiplying a company’s shares outstanding by the current market price of one share.
Market Capitalization = Current Stock Price x Number of Shares outstanding
E.g. Company XYZ has 10,000,000 shares outstanding and its current share price is Rs 8. Based on the above formula, we can calculate that Company XYZ’s market capitalization is Rs 80 million, or 10,000,000 shares x Rs 8 per share.
Market capitalization may be classified differently by different market participants. On a general basis it can be classified in 3 groups when it comes to stocks – *Here, the term ‘cap’ simply refers to the ‘market capitalization’ of the stock.
Differences between Large caps, Mid caps and Small caps
Small cap companies: have a market cap of less than Rs.2,000 crore. They are smaller companies, many of which recently went through their Initial Public Offering, or IPO. They are riskier, because they are more likely to default during a downturn.
Mid cap companies: are less risky, but may not have the same potential for growth. They typically have a capitalization of between Rs.2,000 crore and Rs.10,000 crore. They have lots of room to grow, and could become very profitable over the years while some of them that are fundamentally strong may also become large cap companies over the years due to their consistent profitable performance.
Large cap companies: have the least risk, because they typically have the financial resources to weather a downturn. Since they tend to be market leaders, they also have less room to grow. Therefore, the return may not be as high as small or mid cap stocks. On the other hand, they are more likely to reward stockholders with dividends. The market cap for these companies is Rs.10,000 crore or more.
Why should midcaps form a part of your portfolio? Investments in the large cap companies provide good returns in the long run while investments in the mid cap companies replicate the risk relationship of your portfolio. Large cap equity investments provide stability to your portfolio, mid-cap investing provide quick growth to the fund.
Cautious Investing – the key to midcap investments When markets are booming, returns from mid-cap stocks are good. However, mid-cap stocks may get affected more than large cap companies as they are more susceptible to the downturn in the economy. So any investor investing in midcap mutual funds should decide his risk appetite for the investment horizon and only then should he invest.
Investing in debt funds carries various types of risk. These risks include Credit risk, Interest rate risk, Inflation risk, reinvestment risk etc. But the key risks which needs be considered before investing in Debt funds are Credit Risk and Interest Rate Risk;
Credit Risk (Default Risk): The chances that a borrower might not repay the interest or principle on the committed date is considered as credit risk or default risk. Credit risk is measured by “Credit ratings”. Credit rating agencies like CRISIL, ICRA, CARE etc. rate the issuer of the bond on their ability to repay by assessing their overall financial health.
Illustration: Ratings & the yield
Ratings
Yield
Sovereign
7.78%
AAA+
8.30%
AAA-
8.90%
Illustration: debt papers and their credit rating.
As credit risk increases, the expectation on return also goes up. If a specific debt fund claims to generate very high returns, the first thing that should be checked is the credit risk of the portfolio.
Credit rating can change over a period of time. The performance of companies is measured and the risk assessment is done at periodic intervals. The risk that a fund manager is worried about is not the risk of default but the possible downgrade in credit rating of the debt paper. If a debt paper gets downgraded, the market price of such instrument also comes down which affects the portfolio directly. On the other hand, if the credit rate gets upgraded the fund would be benefited by increase in its fund value.
Credit Spread: The difference in the yield between 2 bonds with the same maturity is called the Credit Spread. As per the illustration given below, the credit spread between Sovereign bond (Govt Bond) and AAA rated bond is 52bps (basis points, 0.52%).
Ratings
Yield
Sovereign
7.78%
AAA+
8.30%
AAA-
8.90%
Interest rate risk Market price of the bond and interest rates carry opposite relationship. Whenever interest rates in the market go up, the market prices of bond come down. Let’s understand this concept with an example:
A bond presently available in the market carries a face value of Rs.100/- offers 8% coupon rate with the left over maturity of 3 years.
The cash flow would be Rs. 8/- interest for next 3 years and Rs. 100/- principal repayment at the end of third year.
The current interest rate offered in the market is 9%
If the bond holder with 8% coupon rate decides to sell his bond, he might have to sell the bond at a discount on face value. The selling price of the bond would be around Rs. 97.47, which is lesser than the face value.
Thus the thumb rule is “When the interest rate in the market rises, the market price of the bond comes down & vice-e-versa”
Measuring interest rate risk – “Modified Duration”: Modified duration measures the price sensitivity of the bond for a given change in interest rate. In simple terms, if the interest rate changes ‘modified duration’ would tell us how much the price of the bond would change. By multiplying the change in interest with the modified duration, the change in the price of the bond/debt fund can be calculated.
Change in the price of the bond/debt fund = change in the interest rate X modified duration
Illustration: Impact on the price of the fund for a given change in interest rate
Modified Duration
if the interest rate rise by 0.50%, price would go down by
if the interest rate goes down by -1.00%, price would rise by
Income fund
8.13
4.07%
-8.13%
Gilt Fund
7.69
3.85%
-7.69%
Dynamic bond fund
7.57
3.79%
-7.57%
Medium term opportunities fund
3.36
1.68%
-3.36%
Short term fund
1.53
0.77%
-1.53%
Liquid
0.07
0.04%
-0.07%
If the duration of the fund is high, the volatility of the fund is considered to be high. Gilt Funds & Bond/Income Funds are considered to be carrying higher interest rate risk in the debt fund family.
Weighted Average Maturity of the portfolio: A portfolio of the debt mutual fund consists of various debt instruments maturing at different point of time. By looking at the weighted average maturity of the portfolio one can identify whether the fund has invested in short, medium or long term debt papers.Why weighted average, Why not average?
Why weighted average, Why not average?
If the portfolio of a debt fund consists of instruments with 3yrs, 5yrs, 7yrs and 10yrs to maturity, to arrive at average maturity, add these four numbers (3+5+7+10 = 25) and divide the same by four. So the average maturity of the portfolio would be 6.25 years. This may not be right way of communicating the maturity because the investments into each of these papers may not be equal.
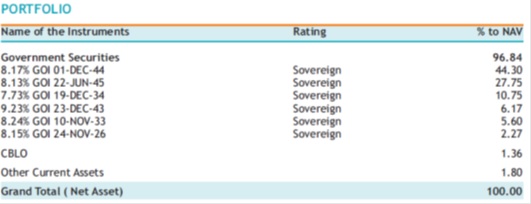
Illustration: Government securities with different maturities and weightages.
In such case, the right way is to use weighted average maturity. First step is to multiply the percentage of holding/allocation of each security with years to maturity.
The total of all the weighted maturities would lead us to Weighted Average Maturity of the portfolio.
Date of Maturity
Years to Maturity
% of Allocation
Weighted maturity
1-Dec-44
28.86
44.30%
12.79
22-Jun-45
29.42
27.75%
8.16
19-Dec-34
18.90
10.75%
2.03
23-Dec-43
27.92
6.17%
1.72
10-Nov-33
17.79
5.60%
1.00
24-Nov-26
10.83
5.43%
0.59
Weighted average maturity of portfolio:
26.29
Higher the Weighted average maturity, longer the term papers of the portfolio and hence higher duration. High duration in a fund means higher volatility and vice-e-versa.
The weighted average maturity is not a constant factor in debt fund portfolio. As the inflationary, interest rate and macro-economic scenarios keep changing, fund managers would keep changing the type of debt instruments in the portfolio. With the change in debt papers, even the maturity of the papers keeps changing.
Following weighted average maturity of the fund portfolio on a monthly basis would give an idea on the fund house view on interest rates.
Illustration: The weighted average maturity of a debt fund portfolio over 3 months.
June
July
Aug
Yield to Maturity (YTM)
7.84%
9.71%
9.36%
Modified Duration
5.17 Years
2.60 Years
6.20 Years
Average maturity
7.91 Years
4.29 Years
12.44 Years
As per the mentioned illustration, fund manager was expecting a rate hike in the month of June that is why he had sold long term holdings and had reduced weighted average maturity of the portfolio from 7.91 to 4.29 years.
Correspondingly even modified duration of the fund has reduced. So during this interest rate hike, the impact on the fund would have been much lesser because Modified duration has been reduced from 5.17 to 2.60 years. As the modified duration reduces, the volatility of the fund reduces. The fund manager’s assessment on the interest rate was also right in the month of July.
The above table is for illustration purpose only & shall not be construed as indicative yields/returns of any of the Schemes of Canara Robeco Mutual Fund. Past performance may or may not be sustained in the future.
The moment we hear the word Mutual Funds, the most heard classic disclaimer “Mutual Fund investments are subject to market risks” rings the bell in our mind. It is very important that we understand what risk is and how it is measured. Experts define risk as a possibility of investment’s actual returns being lesser than the expected returns.
Every fund discloses risk involved in it in the monthly factsheet published by the fund houses. We broadly use Standard Deviation and Portfolio Beta to measure the risk involved in mutual funds.
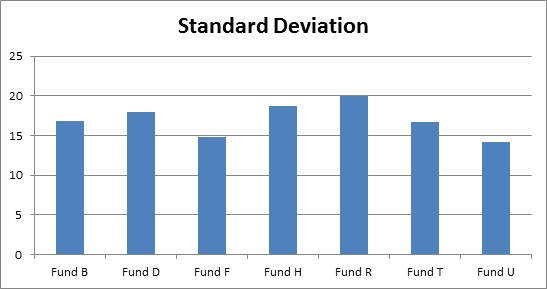
What is Standard Deviation – (SD)? Standard Deviation measures the total/portfolio risk of the fund. The deviation from the average (mean) returns of the fund is called standard deviation. SD tells us the range in which the returns of a mutual fund would fall. Range represents the difference between the lowest returns and the highest returns of the fund.
Fund A
Fund B
Average returns
14
14
Standard Deviation
24
12
Range
.-10 to 38
2 to 26
(Data given are in % terms)
Higher the range in returns indicates higher risk, which is nothing but higher standard deviation. Risk is a relative term; conclusions can be arrived only by comparing multiple funds.
The above said illustration compares the standard deviation of 7 diversified equity funds. When compared fund R carries the highest SD (20) in the category can be called as riskiest fund and Fund U rates below average in risk grade.
What is Beta? Beta measures market risk or systemic risk. In other words, Beta measures the sensitivity of the fund to the changes in the market (Sensex/Nifty). Market beta is assumed as 1 and the fund beta is compared against the market beta. If the fund beta is less than one, then we can conclude that the fund is less volatile in comparison to market and vice-e-versa.
If the fund beta is 0.7 and the market goes down by 1%, then the fund would go down by 0.7% and if the market goes up by 1% the fund would go up by 0.7%. If beta of the fund is 1.2 and the market goes up by 10% then the fund would go up by 12%.
Fund
Beta
Fund B
1.09
Fund D
1.18
Fund F
0.99
Fund H
1.23
Fund R
1.31
Fund T
1.12
Fund U
0.97
Fund R with 1.31 beta is considered as the most volatile fund in the category. In case of Fund U and Fund F, even though the beta of the funds is less than 1, it is still very close to 1 so the risk associated would be closest to the market.
When Beta is compared with Standard Deviation, Beta measures market risk but the Standard Deviation measures total risk (both systematic and un-systematic).
Note: The above table is for illustration purpose only & shall not be construed as indicative yields/returns of any of the Schemes of Canara Robeco Mutual Fund. Past performance may or may not be sustained in the future.
As an investor, it is very important to know what are the charges involved in investing in mutual funds. When your money is handled by a team of experts – stocks are bought and sold on your behalf, periodical communication is sent on investments, charges are given to the intermediaries etc and all these expenses come with a cost.
There are no free lunches. So the question is how much a mutual fund can charge? Is it one time in nature or regular? There are broadly two types of charges:
1. One time charges: Entry Load: The charges that are levied when the units are being purchased. The mutual fund would sell the unit price higher than the NAV. At present Mutual Funds cannot charge entry load.
Exit Load: The mutual fund would buy back the units at rate lower than the NAV. There are no fixed exit loads which are charged. It varies based on the scheme. The current practice is the funds could charge any way from 0.50% to 3.00% depending on the holding period. If the investors continue to hold the investment beyond the specified period, no exit load is charged.
For ex: An equity fund currently at an NAV of Rs. 72/- per unit charges exit load of 1% if the investor exits within 1 year of investment. If an investor wants to sell his mutual fund units, which were bought 7 months back the redemption NAV for such investor would be Rs.71.20/-
Current NAV
72
Exit load 1% of NAV
0.72
Redemption NAV
71.28
If the investor has sold 1000 units, the total exit load applicable would be Rs. 720/-. A Mutual Fund cannot use these charges for paying commission or meeting any of their expenses. This Rs. 720/ should be invested back to the fund, which would benefit the investors who remain invested for long term.
As per this illustration if the investor redeems after 1 year, there is no exit load.
Transaction Charges: These charges are one time charges applicable when the money is invested. This is applicable for the investments of over Rs. 10,000/-. This would be paid to the distributor/intermediary who is selling the fund.
New Investor to Mutual fund
Rs. 150/-
Existing Mutual Fund Investor
Rs. 100/-
SIP Investments
Rs. 100/-
The transaction charges of Rs. 100/- is charged for the SIP commitment of Rs. 10,000/- or above (not monthly SIP amount). The SIP transaction charges are deducted over 4 installments starting from 2nd installment to 5th installment.
2. Recurring Charges (Ongoing expenses/Fund Running Expenses): The expenses are charged on Daily Net Assets of the specific mutual fund. The guideline rates are given by the regulator and Mutual Funds cannot charge more than the stipulated structure. The expenses are deducted every day from the Net Assets of the fund and NAV declared is after adjusting the expenses.
The SEBI limit on TER is as follows:
Daily Net Assets
Equity Funds
Debt Funds
First Rs. 100 Cr
2.50%
2.25%
Next Rs. 300 Cr
2.25%
2.00%
Next Rs. 300 Cr
2.00%
1.75%
Over and above Rs. 700 Cr
1.75%
1.50%
The above given rate are per annum and the expenses are calculated on daily basis.
0.30% of Total Expenses Ratio could be charged on the fund if 30% of the fresh inflows are from cities beyond Top 15 cities in India.
Does the expense ratio vary between funds? There are two categories of diversified equity funds offered by different mutual fund companies. Fund A has a total size of Rs. 1000crs and Fund B has a total size of Rs. 100/- cr. Does it make the difference in-terms of the total expenses charged by the fund?
Fund A: Expense structure of a Fund with Net Assets of Rs. 1000 Cr
First Rs. 100 Cr
2.5% of Rs. 100 Cr
Rs. 2.50 Cr
Next Rs. 300 Cr
2.25% of Rs. 300 Cr
Rs. 6.75 Cr
Next Rs. 300 Cr
2% of Rs. 300 Cr
Rs. 6.00 Cr
Over and above Rs. 700 Cr
1.75% on the balance Rs. 300 Cr
Rs. 5.25 Cr
Total Expenses
Rs. 20.50 Cr
Fund B: Expense structure of a fund with Net Assets of Rs. 100 Cr
First Rs. 100 Cr
2.5% of Rs. 100 Cr
Rs. 2.50 Cr
Total Expenses
Rs. 2.50 Cr
Even though the expense ratio structure is stipulated by the regulator, it varies based on the size of the net assets of the fund. Higher the net assets, lower expense ratio and lower the net assets higher the expense ratio.This in turn impacts the returns generated by the respective mutual fund. In-case of funds like Liquid funds, the difference in expense ratio would be one factor
Fund Size
Expense ratio computation
Expense Ratio
Fund with Rs. 1000 Cr Net assets
Rs. 20.50/1000 Cr
2.05%
Fund with Rs. 100 Cr Net assets
Rs. 2.50/100 Cr
2.50%
The above example is only for illustration purposes.
Shreya, a successful business woman, firmly believes in savings and has invested her money in Fixed Deposits and Mutual Funds. Her understanding is that all the interest earning from Deposits would attract an income tax of 10% in case the interest income is above Rs. 10,000/- p.a. She is unsure of the tax implication on mutual funds.
While filing the income tax returns, the tax consultant mentions that Shreya will have to pay more tax on the interest income earned and on the mutual fund which she had redeemed in the previous year. She wants to understand the tax implications on her investments.
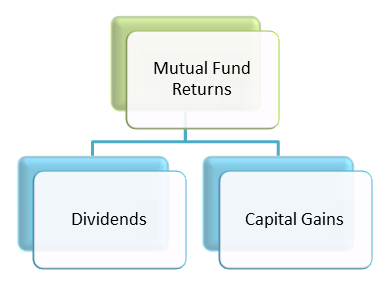
An investor in mutual funds could earn the returns broadly in 2 forms;
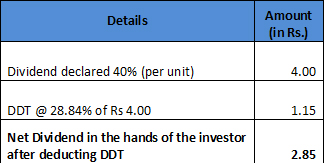
Dividends: The dividends would attract “Dividend Distribution Tax” (DDT), which would be deducted at source by Mutual Funds and then distributed further to the investors. There is no dividend distribution tax applicable on dividends declared by Equity Oriented Mutual Funds. DDT is applicable only on non-equity oriented mutual funds (Debt funds, Gold funds etc).
Dividends received from mutual funds are tax free in the hands of the investor.Dividend Distribution Tax (DDT) – Applicable tax rates for the Financial Year 2016-17
Dividends are declared on face value of the mutual fund units i.e. Rs. 10/-. If a mutual fund declares a dividend of 40%, it means an investor would get Rs. 4/- as dividend for every unit he is holding.
The post DDT amount of Rs. 2.85 would be passed on to the investor, which is tax free in his hands.
Taxation on interest income: The common misunderstanding on treatment of interest income earned from bank deposits is that it is exempted if the interest earned is less than Rs 10,000/-p.a and taxed at 10% if the earning is more than Rs. 10,000/- p.a which is deducted by the bank before paying the interest.
But in reality the interest earned through deposits is fully taxable. It is taxed at marginal tax rate. This means that the interest income will be treated as “income from other sources” and will get added to the total income while computing the tax liability. The investor would end up paying tax based on his income tax slab. So effectively, an investor with an annual income of more than Rs. 10 Lakhs would fall in 30% income tax slab and would end up paying close to 30% tax on the interest income from deposits as well.
Sharath, an enthusiastic entrepreneur, has started his business immediately after his graduation. He is running his business for the last 2 years and the business has started doing reasonably well in the last couple of months resulting in positive cash flows. Since he is left with some surplus cash in his business as well as in his hands, he would like to invest the same for the rainy day. When he visits the bank, he discusses the investment options with the relationship manager and requests for opening up Fixed Deposit account. The relationship manager suggests a category of mutual funds instead of bank deposits, but Sharath is concerned that investing in equity would be too risky.
Another wrong perception which people carry about mutual funds is that Mutual Fund means Equity Mutual funds and take exposure only in equity/stock markets.
Mutual funds are investment vehicles which helps the investors to invest in marketable securities. Marketable securities could be Equity/Stocks, Bonds/Debt and Gold. When a mutual fund is launched, it could be a fund which invests majority in equity stocks or Bonds or Gold or combination of the asset classes.
Broadly mutual funds could be categorized into 3 types;
Equity Mutual Funds
Debt Mutual Funds
Hybrid Funds
Equity Mutual Funds: Equity oriented mutual funds where majority of the assets are invested in stocks. To broadly distinguish the Equity and non-equity oriented funds, the income tax department has come up with a definition of equity oriented funds. To qualify as equity oriented fund, the said mutual fund should have invested 65% of average annual net assets in Indian listed equities directly. Any other fund which doesn’t come under this definition would be considered as non-equity fund/debt fund for the purpose of taxation.
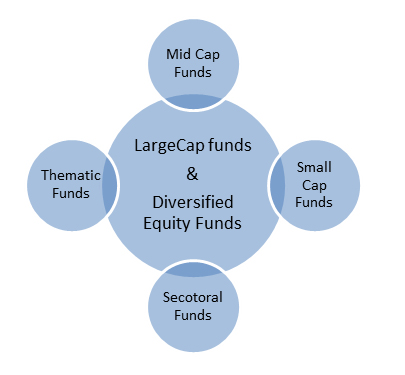
Types of equity mutual funds :
Large cap fund
Mid cap fund
Small cap fund
Diversified Equity Funds
Sectoral funds
a. Large cap funds: Money collected under this fund is invested in large sized companies. The size of the company is defined based on the market capitalization (Market Capitalization = no of shares issued by the company X market price per share) of the company. There is no standard definition to categorize the companies based on the size. However, one way of categorizing the companies could be top 50 stocks listed in BSE/NSE are called as “Large Cap”. The other way of categorizing large cap stocks could be, any stock with a market capitalization beyond Rs. 10,000 crs. Some of the large cap companies are Tata Consultancy Service, Reliance Industries, Sun Pharma, ONGC, Infosys, ICICI Bank etc. Large cap stocks are generally considered as a safe but because of this fact they are less volatile.
b. Mid Cap Funds: The stocks selected by the fund manager for this category of funds are generally considered as future leaders. One way of identifying mid cap stocks could be 150 stocks beyond large cap stocks are considered as mid cap. Other school of thought defines Mid-cap stocks with a market capitalization between Rs. 2000 – Rs. 10,000 crs. Since the mid-sized companies are not fully grown into large sized companies, these stocks have higher growth potential when compared to large cap stocks. Because of this, mid-cap stocks tend to outperform in bullish markets and vice versa.
c. Small Cap Funds: Stocks with market capitalization of less than Rs. 2000 crs is considered as small cap. They are in the large numbers compared to large and mid-cap, hence making the life of a fund manager difficult in choosing the right set of the stocks for the portfolio.
“Catch them young”: Small cap stocks carry great potential for multi bagger returns in the long run; it’s like identifying Infosys stock at the initial stages of the company life cycle. But small cap stocks tend to be more volatile compared to Large and Mid-cap stocks and perform only at specific market cycles. Because of this nature, small cap stocks are considered to be riskiest among the three categories.
d. Diversified Equity Funds: The portfolio of Diversified equity funds is a combination of Large, Mid and Small cap stocks. Majority of the assets in the fund would be invested into Large cap stocks. There is no set standard allocation which diversified equity funds follow; every fund manager would have specific strategy for managing the fund.The other funds like “Opportunities Funds” also come under the category of diversified equity funds.
During the bearish phase of the market, a diversified equity fund might invest 85% of the corpus into Large Cap stocks and balance 15% would be allocated between Mid & Small Cap stocks. The fund manager would take a moderate aggressive stand in the bullish market by investing 75-80% in Large Cap and the rest in Mid and Small cap stocks.
Diversified equity funds would give stability and consistency of large cap funds by investing predominantly in Large cap and the Mid & Small Cap stocks would act as a returns booster to the portfolio.
e. Sectoral Funds: As the name suggests, the money collected under this fund invests in a specific sector for eg: Pharmaceutical, Banking, FMCG etc. Sectoral funds are considered as riskiest funds in equity mutual funds category, because the performance of different sectors is cyclical in nature. Not all the sectors perform at the same time. At any given point of stock market cycle different sectors tend to perform.
To make the best out of sectoral funds, an investor would have to enter the fund at the right time.
Risk – Return trade off of Equity funds:
Positioning of Equity Mutual Funds: There are no set rules for creating a portfolio of equity funds; ideally the portfolio creation should happen with the help of the expert called as financial advisor. He would understand the customer and based on the needs, the portfolio would be suggested.
The basic thumb rule which an investor could follow is having a “Large Cap fund” and a “Diversified Equity Fund”. These two are an essential element in every portfolio. These two funds are like all season products which one should invest in.
Keeping the above mentioned point in mind, the equity investment portfolio could be divided into two parts:
1. Core Portfolio: This is an all season portfolio. 70-80% of the equity investment should ideally go into core portfolio. The overall risk is lesser and generates consistent return to the portfolio. The Core portfolio should ideally consist of existing Large Cap and Diversified Equity Funds with a longer track record. In some cases where the investor has a longer investment horizon, he could take exposure to Mid cap funds as well.
The funds selected and invested in are generally for a longer investment horizon and this portfolio doesn’t go through constant changes.
2. Satellite Portfolio: This portfolio changes as per the seasons and flavors. Active management is involved in handling this portfolio. 20-30% of the equity investments could go into this portfolio. Mid &Small cap funds, Small cap funds, Sectoral and Thematic funds should be part of this portfolio. Even new funds offered could be a part of this portfolio as well.
Once we are convinced about the fact that savings and investments are essential, the next logical step is to decide where to and how much to invest. An individual needs to define his/her financial goals and put them in the order of priority. This would ideally be the first step prior to deciding where to and how much to invest. The financial goals in order of priority could be;
Corpus meant for Emergency Retirement Buying a Car & House Children’s Higher education
To begin with, corpus required for emergency purposes should be the first saving to be done even beforeyou start investing. It could be the total amount required for running the monthly expenses for the period of 4-6 months. Once the emergency corpus is set aside, further investments should be made to meet other financial goals. The SIP investments should ideally be linked to specific financial goals.
Experts always recommend that the amount to be invested in an SIP is dependent on an individual’s financial goals. The SIP amount should ensure that at the time of realizing the financial goal, the corpus accumulated through the SIP is sufficient enough to meet the goal.
How to determine a financial goal? First step is to ascertain the current cost of the proposed goal. For instance the current cost of engineering is Rs. 600,000/- in the city of Bangalore. If the child would go for higher education 15 years from now and assuming the cost of education is escalated by 8% p.a., an individual would need close to Rs. 19 Lakhs then to meet the goal of child’s higher education.
To get this Rs. 19 lakhs in 15 years, one can look at starting an SIP Rs. 3400/- pm approximately in a mutual fund scheme with an assumed rate (CAGR) of 14% p.a.
This looks good and right when we isolate a financial goal and arrive at how much SIP amount is required for getting there. Only when we start defining all the goals and put a plan around it, can we save appropriately for all our goals.
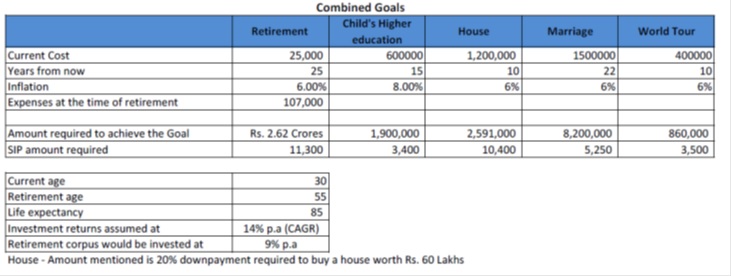
Combining financial goals: Goal based planning is the right way to approach investments. Hence, the right SIP amount should be based on the financial goals. As per the below mentioned illustration, if an individual arrives at a complete financial plan and start investing based on the financial goals he would need close to Rs. 33850/- on a monthly basis in Mutual fund SIPs to achieve the financial goals
The only challenge would be where to get SIPs of Rs. 33,850/- every month. If an individual who is 30 years of age and is spending Rs. 25,000/- towards monthly expenses, might not have so much surplus on a monthly basis. This situation could lead an individual to believe that this is not easy and he/she would start thinking about investing once he/she starts earning more. Larger sums of money in the form of SIP might just scare people away.
Power of human capital: The biggest advantage we have is that our income level doesn’t remain same throughout. It increases almost every year. Aon Hewitt salary survey of 2014-15 states the in India the salaries have grown at an average of 11.80%p.a over the last 15 years (from 2001-2015) even after factoring recessionary and slow down years.
So our income increases year on year. As per the thumb rule, even if we start saving 15% of our income, our investment would also start increasing every year. Keeping this in mind, even if an investor starts a smaller sum in an SIP and constantly increases by say 10% every year,he/she might just reach the financial goals without burdening the current finances.
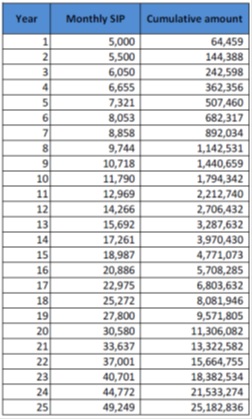
Incremental SIP: As per the illustration given above, an individual who is 30 years old would require 2.62 crores at the age of 55 to manage her retirement. To get the desired corpus, she will have to invest Rs. 11,300/- in SIPs every month. This SIP of Rs. 11,300/- would only be directed towards retirement goal and she will have to save much more for other goals.
As per our incremental SIP method, she can start a smaller amount of SIP but such amount should be increased by 10% every year. If she starts an SIP of Rs. 5000/- every month with an assumed rate of 14% p.a and increase the SIP amount by 10% for next 25 years, the corpus accumulated would be close to Rs. 2.52 crores. Since the increase in SIP is gradual and in line with the increase in the income levels, the retirement goal looks achievable.
To sum up, what is the right SIP amount, first step is to determine the financial goal. Start a small amount of SIP, but ensure the SIP amount is increased consistently in line with increase in income.
Start small, but start early! The above table is for illustration purpose only & shall not be construed as indicative yields/returns of any of the Schemes of Canara Robeco Mutual Fund. Past performance may or may not be sustained in the future.
In financial terms, the bond equivalent yield (BEY) is a metric that lets investors calculate the annual percentage yield for fixed-income securities, even if they are discounted short-term plays that only pay out on a monthly, quarterly, or semi-annual basis. It is a rate that helps an investor determine the annual yield of a bond (or any other fixed-income security), that does not provide an annual payout. In other words, bond equivalent yield helps an investor find an “equivalent yield” between two or more bonds.
By having BEY figures at their fingertips, investors can compare the performance of these investments with those of traditional fixed income securities that last a year or more and produce annual yields. This empowers investors to make more informed choices when constructing their overall fixed-income portfolios. The formula of Bond Equivalent Yield is:
BEY=(( Par Value – Purchase Price ) ÷ ( Purchase Price )) × (365÷d)
Where
d=Days to maturity on which the par value will be paid to the investor
Par value= price that will be paid on maturity of the bond.
Purchase price= price the investor paid for acquiring the bond (lesser than the par value in the case of a deep discount or zero-coupon bond)
Illustration:
Fixed Income Security
Par Value
Purchase Price
Days to Maturity
BEY (%)
Bond A
1000
925
180
16.44%
Bond B
1000
950
120
16.01%
From the above BEY calculations, it can be concluded that Bond A is a better investment option since its yield is higher as compared to Bond B.
How is Bond Equivalent Yield useful? Bonds and other related fixed-income securities offer periodic interest payments to investors referred to as coupon payments, provide a steady stream of income for bond investors. But some bonds, referred to as zero-coupon bonds, do not pay interest at all. Instead, they are issued at a deep discount to par, and investors collect returns when the bond matures.
To compare the return on discounted fixed income securities with the returns on traditional bonds, BEY formula makes a logical comparison.
BEY is especially useful when an investor has to decide between two or more fixed investment products with different maturities.
Since returns are one of the primary criteria for making any investment choice, it becomes absolutely essential to compare the rates of return of different investment instruments, despite the difference in payment frequencies. However, the downside of using the BEY method is that it does not recognize the effect of compounding for shorter duration bonds and therefore might not provide a true and fair picture in certain situations.
Key Takeaways
Bond equivalent yield (BEY) allows investors to calculate the annual percentage yield for fixed-income securities including those which pay out in the short term
BEY helps an investor find an “equivalent yield” between two or more bonds
Between two securities, the one with the higher BEY is more favourable
BEY is very useful to compare two or more fixed investment products with different maturities
However, it does not recognize the effect of compounding for shorter duration bonds and therefore might not provide a true and fair picture in certain situations
This material is part of an Investor Education and Awareness Initiative of Canara Robeco Mutual Fund
We Indians have inherited the habit of savings since generations. Earlier, people used to save their hard-earned money to meet planned expenses. They would squirrel away a part of their income by keeping it in some safe location and forgetting it only to look for it when there was a need for funds to meet shortfalls. Wonder whether this will work in today’s time as well? Again, this money was lying idle and not earning anything. Gone are the days when savings were just sufficient enough to meet our future needs. With the changing social structure, increased life expectancy, changing lifestyles and needs etc., one needs something more than just savings.
Another inevitable reason why just savings are not enough is inflation. Price of goods today will not be same tomorrow; money gets dearer with each passing moment. To accumulate wealth, at the same time beat inflation, one needs to invest and not just save.
An investor can invest in various instruments such as gold, equity, debt etc. Each instrument has its unique risk and return profile and an investor must carefully analyse all parameters before investing. From a long-term perspective, equity as an asset class scores over other asset classes in terms of performance. Here are a few reasons why investing in equity as an asset class is important:
Higher inflation-adjusted returns
Since investing in equities is akin to investing in the company itself; equity investments generally have the potential to generate higher returns (albeit with higher risks involved). These returns, generally, beat inflation and give the investor real returns on their investment amount over long term. This coherent nature of equities makes it a preferred investment option for investors who have moderate to high-risk appetite.
Meet financial goals
Different investors have different financial goals such as marriage, buying house, going on a vacation, children’s education etc. These goals are generally long term in nature and the quantum required to meet these is high.
The income generated from traditional savings schemes helps to meet financial goals to some extent but they are not enough when inflation comes into play. Equity provides the much-needed push to returns and facilitates a long-term wealth creation opportunity to help achieve one’s goal.
Tax-free dividends & capital gains
Unlike the interest earned on traditional savings instruments, equity investors do not need to pay any tax for the dividends earned. Also, there is no long-term capital gain tax on equity investments held for more than one year.
Easy liquidity option
Most of the traditional saving instruments come with a lock-in period. Early liquidation is not possible in some cases and even if it is possible, it comes with a penalty. An investor tends to lose if he/she withdraws before the said period. Investing in real estate could also be another medium of investment. However, it is fairly illiquid and involves a higher initial investment outlay. In case of urgent requirement of funds, the investor might not get a buyer or might not get the relevant and appropriate price for the asset. Equity, on the other hand, as an investment provides easy liquidity. There is the complete transparency as regards the exit price and charges, if any.
While investing in equities acts as a good portfolio diversifier and a catalyst to returns, it requires thorough research and expertise to pick the right stock. Even after investing in a stock, investor needs to constantly track not only company’s financials but also related non-financial events and macro-economic events. Rather than undertaking such tedious tasks on their own, investors can invest in equities through the mutual fund route. There are various benefits of investing in equities via mutual fund:
Investor need not research each company.
Facilitates professional management of funds at a relatively low cost. The fund managers are better equipped to take call on investment, given the experience to handle the volatility.
Enables investor to diversify the portfolio by investing across various companies and sectors.
Mutual fund provides a facility called as “systematic investment plan, which helps an investor to invest fix amount at fixed time interval. As equity markets are generally volatile and one cannot time the market, it is beneficial for investors to take the SIP route and stay invested during different market conditions.
When it comes to equity investing, an investor should keep in mind that “equity investing requires time in the market rather than timing the market.”
Get The App Now!
Gain financial control. Budget, save, and invest with ease, all in one app.
 Compare Schemes
 Contact Us
 Statements